View, delete or export reports
To open the Reports Center, click Reports on the main menu.
View a report:
- Click the category under which the report is located.
- Click on the report from within the category.
Example: If you're looking for a particular billing errors report:
- Open the Reports Center.
- Click on the Billing Discrepancies sub-menu. A list of all reports that can be generated or that have already been generated and saved.
- When you find the report you want to view, click on it. The report, with all its parameters and data, opens.
Delete a saved report:
You cannot delete Base-line reports. You can only delete reports you have saved.
- Click the category under which the report is located.
- Click on the report from within the category.
- Click the X in the report's entry. A confirmation message appears.
- Click OK.
Note: Report deletion cannot be undone. Make absolute certain that you don't need a report before you delete it.
Export a Report
Depending on the report, you can choose to export report data, visuals or both. Not all reports support graphs and do not have a Visual tab - these reports can only be exported as Data reports.
- Open the report you want to export.
-
Select the Data or Visual tab. The Export form opens.
-
If applicable, edit the Name of the report.
Note: You can't export your report if you try to save a report with a name containing the following special characters: {, }, [, ], <, >, *, /, \, :, ?, ", or |. Should you attempt use any of these characters in a name, an error message appears blocking your action. In this event, click OK to close the error message, and then enter a name without these characters.
-
Select or clear Data or Visual.
-
If you selected Data, select the Type: Flat, Collapsed, or Expanded.
Note: Regardless of whether a report is a flat report or a nested report, it can be exported in flat data format. Unless your report is nested or grouped, it will automatically be exported as flat.
- If you select Visuals:
- Select the graph. You can choose more than one.
Select the Format.
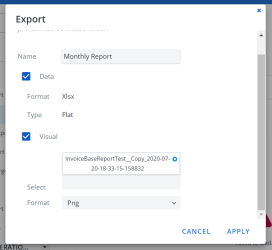
- Click Apply. Your report automatically downloads.

Your report is exported as a ZIP file. Inside this ZIP file, you'll find all of the graphs you created as PNG files, as well as a text document outlining all of the filtering customization for your graphs and report grid, and an Excel sheet with the report grid.
Export graphs individually:
- Select the Visual tab.
- Click More Options
 for a specific graph displayed in the Visual tab. A drop-down menu opens.
 - Click Export. The graph automatically downloads as a PNG.